Using a graphical interface
In the previous tutorial we measured the IV characteristic of a sample to show how we can set up a simple experiment in PyMeasure. The real power of PyMeasure comes when we also use the graphical tools that are included to turn our simple example into a full-fledged user interface.
Using the Plotter
While it lacks the nice features of the ManagedWindow, the Plotter object is the simplest way of getting live-plotting. The Plotter takes a Results object and plots the data at a regular interval, grabbing the latest data each time from the file.
Warning
The example in this section is known to raise issues when executed: a QApplication was not created in the main thread / nextEventMatchingMask should only be called from the Main Thread warning is raised. While the example works without issues on some operating systems and python configurations, users are advised not to rely on the plotter while this issue is unresolved. Users can hence skip this example and continue with the Using the ManagedWindow section.
Let’s extend our SimpleProcedure with a RandomProcedure, which generates random numbers during our loop. This example does not include instruments to provide a simpler example.
import logging
log = logging.getLogger(__name__)
log.addHandler(logging.NullHandler())

import random
from time import sleep
from pymeasure.log import console_log
from pymeasure.display import Plotter
from pymeasure.experiment import Procedure, Results, Worker
from pymeasure.experiment import IntegerParameter, FloatParameter, Parameter

class RandomProcedure(Procedure):

    iterations = IntegerParameter('Loop Iterations')
    delay = FloatParameter('Delay Time', units='s', default=0.2)
    seed = Parameter('Random Seed', default='12345')

    DATA_COLUMNS = ['Iteration', 'Random Number']

    def startup(self):
        log.info("Setting the seed of the random number generator")
        random.seed(self.seed)

    def execute(self):
        log.info("Starting the loop of %d iterations" % self.iterations)
        for i in range(self.iterations):
            data = {
                'Iteration': i,
                'Random Number': random.random()
            }
            self.emit('results', data)
            log.debug("Emitting results: %s" % data)
            self.emit('progress', 100 * i / self.iterations)
            sleep(self.delay)
            if self.should_stop():
                log.warning("Caught the stop flag in the procedure")
                break


if __name__ == "__main__":
    console_log(log)

    log.info("Constructing a RandomProcedure")
    procedure = RandomProcedure()
    procedure.iterations = 100

    data_filename = 'random.csv'
    log.info("Constructing the Results with a data file: %s" % data_filename)
    results = Results(procedure, data_filename)

    log.info("Constructing the Plotter")
    plotter = Plotter(results)
    plotter.start()
    log.info("Started the Plotter")

    log.info("Constructing the Worker")
    worker = Worker(results)
    worker.start()
    log.info("Started the Worker")

    log.info("Joining with the worker in at most 1 hr")
    worker.join(timeout=3600) # wait at most 1 hr (3600 sec)
    log.info("Finished the measurement")
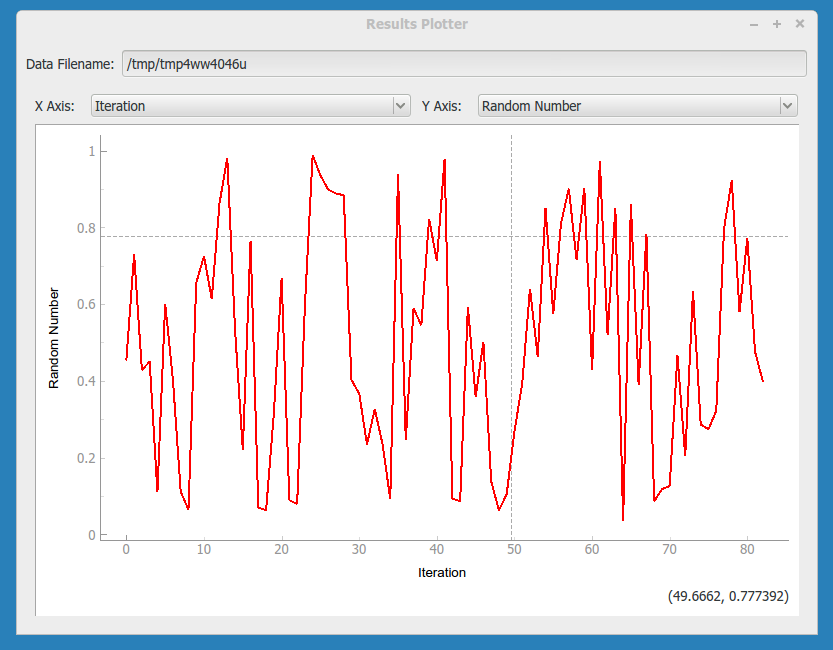
The important addition is the construction of the Plotter from the Results object.
plotter = Plotter(results)
plotter.start()
The Plotter is started in a different process so that it can be run on a separate CPU for higher performance. The Plotter launches a Qt graphical interface using pyqtgraph which allows the Results data to be viewed based on the columns in the data.
Using the ManagedWindow
The ManagedWindow is the most convenient tool for running measurements with your Procedure. This has the major advantage of accepting the input parameters graphically. From the parameters, a graphical form is automatically generated that allows the inputs to be typed in. With this feature, measurements can be started dynamically, instead of defined in a script.
Another major feature of the ManagedWindow is its support for running measurements in a sequential queue. This allows you to set up a number of measurements with different input parameters, and watch them unfold on the live-plot. This is especially useful for long running measurements. The ManagedWindow achieves this through the Manager object, which coordinates which Procedure the Worker should run and keeps track of its status as the Worker progresses.
Below we adapt our previous example to use a ManagedWindow.
import logging
log = logging.getLogger(__name__)
log.addHandler(logging.NullHandler())

import sys
import tempfile
import random
from time import sleep
from pymeasure.log import console_log
from pymeasure.display.Qt import QtWidgets
from pymeasure.display.windows import ManagedWindow
from pymeasure.experiment import Procedure, Results
from pymeasure.experiment import IntegerParameter, FloatParameter, Parameter

class RandomProcedure(Procedure):

    iterations = IntegerParameter('Loop Iterations', default=100)
    delay = FloatParameter('Delay Time', units='s', default=0.2)
    seed = Parameter('Random Seed', default='12345')

    DATA_COLUMNS = ['Iteration', 'Random Number']

    def startup(self):
        log.info("Setting the seed of the random number generator")
        random.seed(self.seed)

    def execute(self):
        log.info("Starting the loop of %d iterations" % self.iterations)
        for i in range(self.iterations):
            data = {
                'Iteration': i,
                'Random Number': random.random()
            }
            self.emit('results', data)
            log.debug("Emitting results: %s" % data)
            self.emit('progress', 100 * i / self.iterations)
            sleep(self.delay)
            if self.should_stop():
                log.warning("Caught the stop flag in the procedure")
                break


class MainWindow(ManagedWindow):

    def __init__(self):
        super().__init__(
            procedure_class=RandomProcedure,
            inputs=['iterations', 'delay', 'seed'],
            displays=['iterations', 'delay', 'seed'],
            x_axis='Iteration',
            y_axis='Random Number'
        )
        self.setWindowTitle('GUI Example')


if __name__ == "__main__":
    app = QtWidgets.QApplication(sys.argv)
    window = MainWindow()
    window.show()
    sys.exit(app.exec())
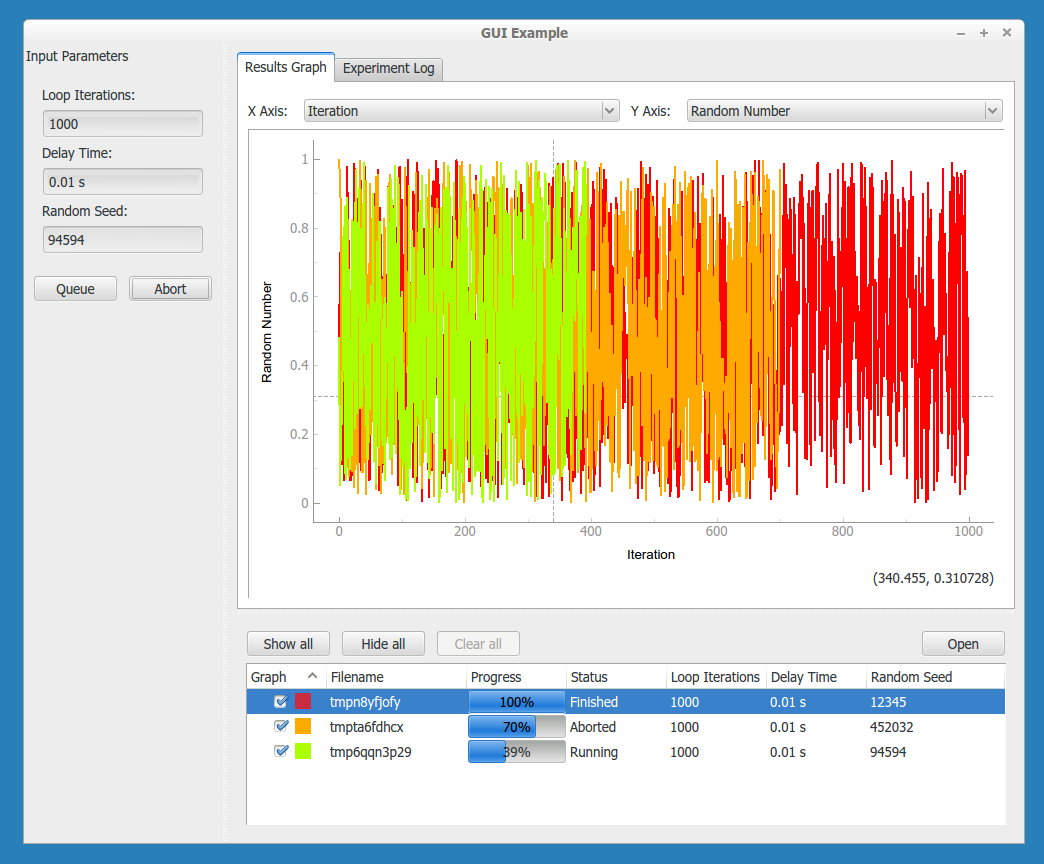
This results in the following graphical display.
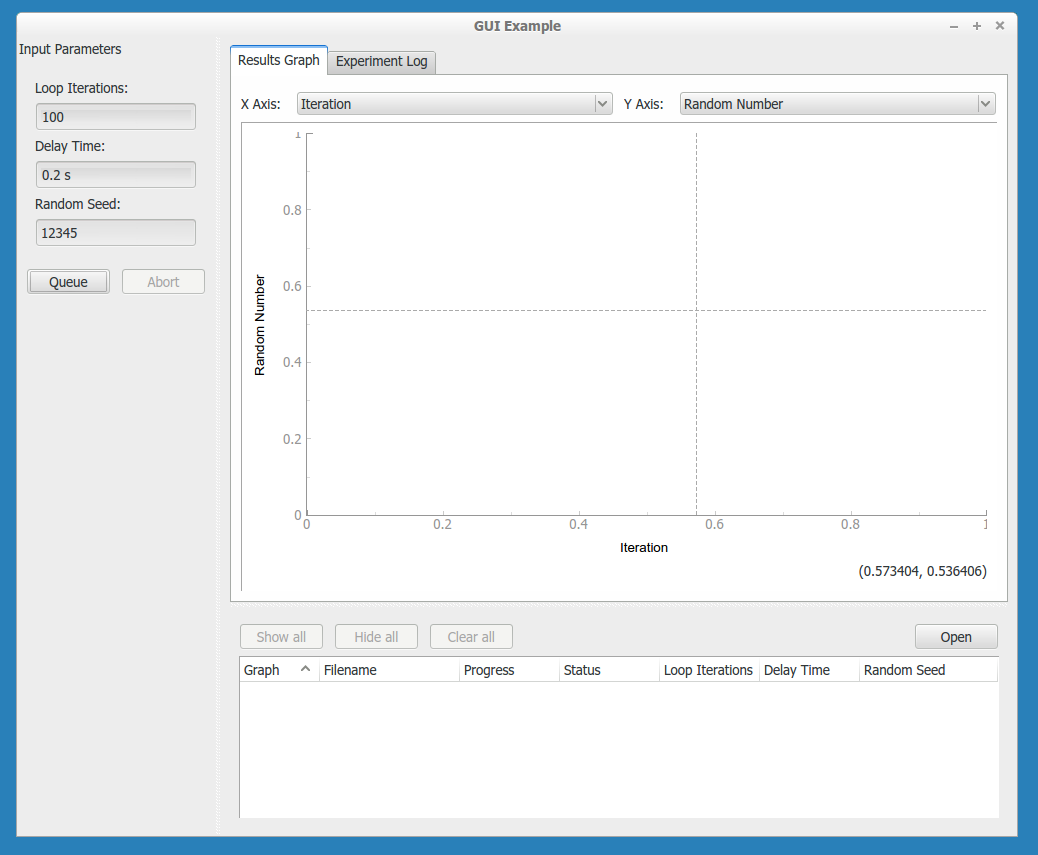
In the code, the MainWindow class is a sub-class of the ManagedWindow class. We override the constructor to provide information about the procedure class and its options. The inputs are a list of Parameters class-variable names, which the display will generate graphical fields for. When the list of inputs is long, a boolean key-word argument inputs_in_scrollarea is provided that adds a scrollbar to the input area. The displays is a list similar to the inputs list, which instead defines the parameters to display in the browser window. This browser keeps track of the experiments being run in the sequential queue.
As a bit of background information (for basic usage this needs not be known): the queue() method establishes how the Procedure object is constructed.
The make_procedure() method is used to create a Procedure based on the graphical input fields.
Here we are free to modify the procedure before putting it on the queue.
In this context, the Manager uses an Experiment object to keep track of the Procedure, Results, and its associated graphical representations in the browser and live-graph.
This is then given to the Manager to queue the experiment.
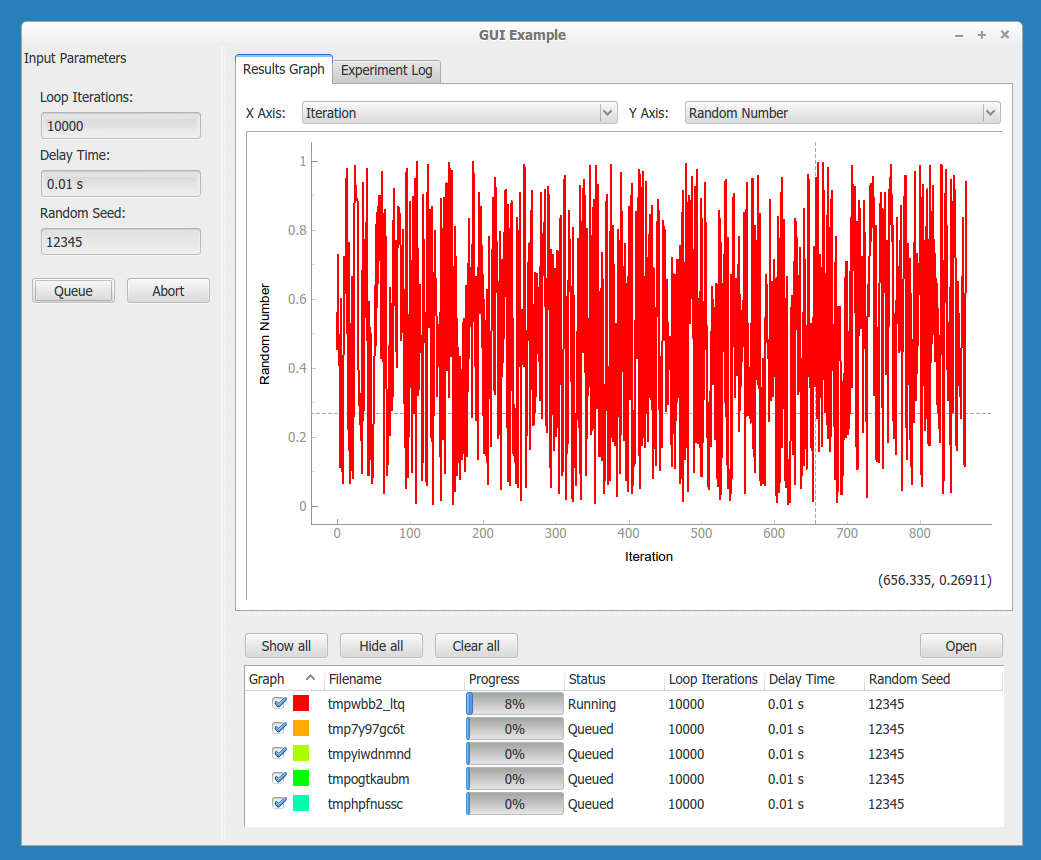
By default the Manager starts a measurement when its procedure is queued. The abort button can be pressed to stop an experiment. In the Procedure, the self.should_stop call will catch the abort event and halt the measurement. It is important to check this value, or the Procedure will not be responsive to the abort event.
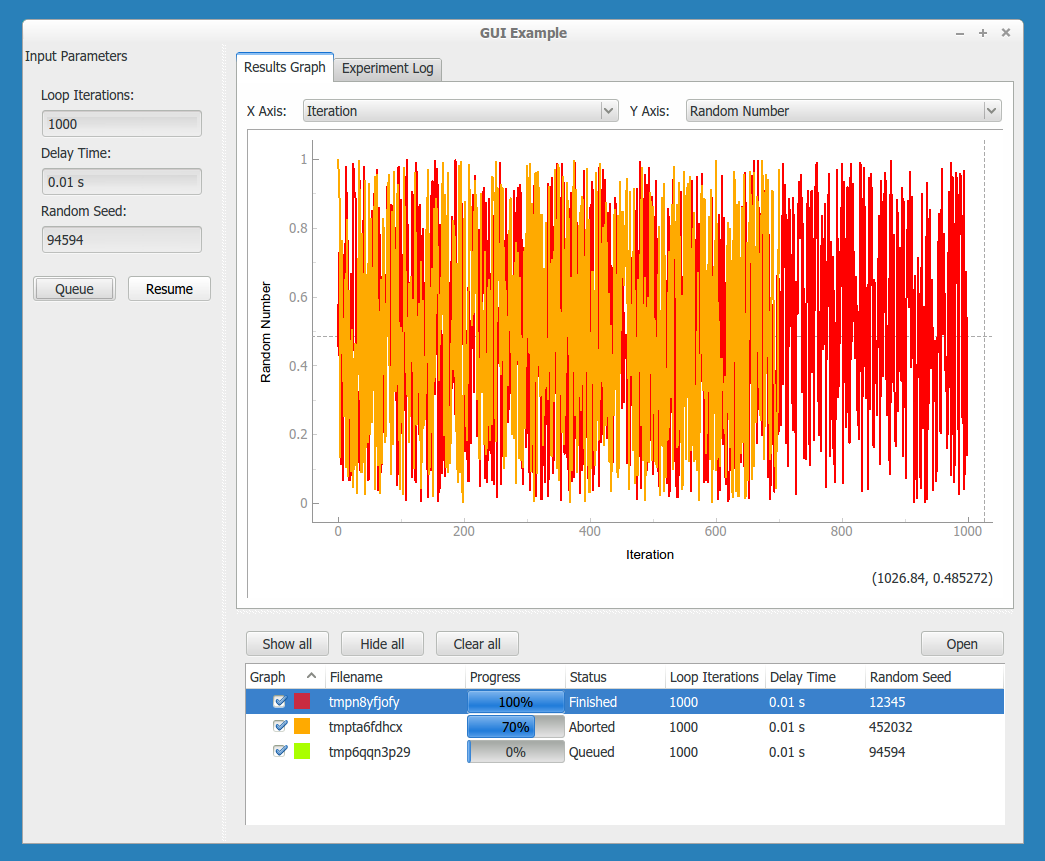
If you abort a measurement, the resume button must be pressed to continue the next measurement. This allows you to adjust anything, which is presumably why the abort was needed.
Now that you have learned about the ManagedWindow, you have all of the basics to get up and running quickly with a measurement and produce an easy to use graphical interface with PyMeasure.
Note
For performance reasons, the default linewidth of all the graphs has been set to 1. If performance is not an issue, the linewidth can be changed to 2 (or any other value) for better visibility by using the linewidth keyword-argument in the Plotter or the ManagedWindow. Whenever a linewidth of 2 is preferred and a better performance is required, it is possible to enable using OpenGL in the import section of the file:
import pyqtgraph as pg
pg.setConfigOption("useOpenGL", True)
The filename and directory input
By default, a ManagedWindow instance contains fields for the filename and the directory (as part of the FileInputWidget) to control where the results of an experiment are saved.
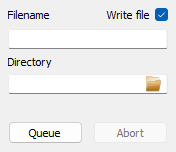
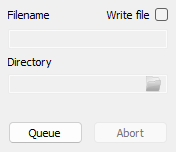
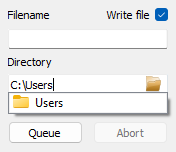
If the checkbox named Save data is enabled, the measurement is written to a file. Otherwise, it is stored in a temporary file.
The filename in the designated field can be entered with or without extension.
If the entered extension is recognized (by default .csv and .txt are recognized), that extension is used.
If the extension is not recognized, the first of the available extensions will be used (default is .csv).
Additionally, a sequence number is added just before the extension to ensure the uniqueness of the filename.
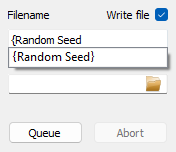
The filename can also contain placeholders, which are filled in using the standard python format function (i.e., placeholders can be entered as '{placeholder name:formatspec}').
Valid placeholders are the names of the all the input parameters or metadata of the measurement procedure; the valid placeholders are listed in the tooltip of the input field.
As the standard format functionality is used, the placeholders can be formatted as such; for example, the filename 'DATA_delay{Delay Time:08.3f}s' gets formatted into 'DATA_delay0000.010s'.
Both the filename and the directory field are provided with auto-completion to help with filling in these fields. The directory field contains a button on the right side to open a folder-selection window.
The default values can be easily set after the ManagedWindow has been initialized; this allows setting a default location and a default filename, changing the default recognized extensions, control the default toggle-value for the Save data option, and control whether the filename input field is frozen.
 class MainWindow(ManagedWindow):

     def __init__(self):
         super().__init__(
             procedure_class=TestProcedure,
             inputs=['iterations', 'delay', 'seed'],
             displays=['iterations', 'delay', 'seed'],
             x_axis='Iteration',
             y_axis='Random Number',
         )
         self.setWindowTitle('GUI Example')

         self.filename = r'default_filename_delay{Delay Time:4f}s'   # Sets default filename
         self.directory = r'C:/Path/to/default/directory'            # Sets default directory
         self.store_measurement = False                              # Controls the 'Save data' toggle
         self.file_input.extensions = ["csv", "txt", "data"]         # Sets recognized extensions, first entry is the default extension
         self.file_input.filename_fixed = False                      # Controls whether the filename-field is frozen (but still displayed)
The presence of the widget is controlled by the boolean argument enabled_file_input of the ManagedWindow init.
Note that when this is set to False, the default queue() method of the ManagedWindow class will no longer work, and a new, custom, method needs to be implemented; a basic implementation is shown in the documentation of the queue() method.
Customising the plot options
For both the PlotterWindow and ManagedWindow, plotting is provided by the pyqtgraph library. This library allows you to change various plot options, as you might expect: axis ranges (by default auto-ranging), logarithmic and semilogarithmic axes, downsampling, grid display, FFT display, etc. There are two main ways you can do this:
You can right click on the plot to manually change any available options. This is also a good way of getting an overview of what options are available in pyqtgraph. Option changes will, of course, not persist across a restart of your program.
You can programmatically set these options using pyqtgraph’s PlotItem API, so that the window will open with these display options already set, as further explained below.
For Plotter, you can make a sub-class that overrides the setup_plot() method. This method will be called when the Plotter constructs the window. As an example
class LogPlotter(Plotter):
    def setup_plot(self, plot):
        # use logarithmic x-axis (e.g. for frequency sweeps)
        plot.setLogMode(x=True)
For ManagedWindow, the mechanism to customize plots is much more flexible by using specialization via inheritance. Indeed ManagedWindowBase is the base class for ManagedWindow and ManagedImageWindow which are subclasses ready to use for GUI.
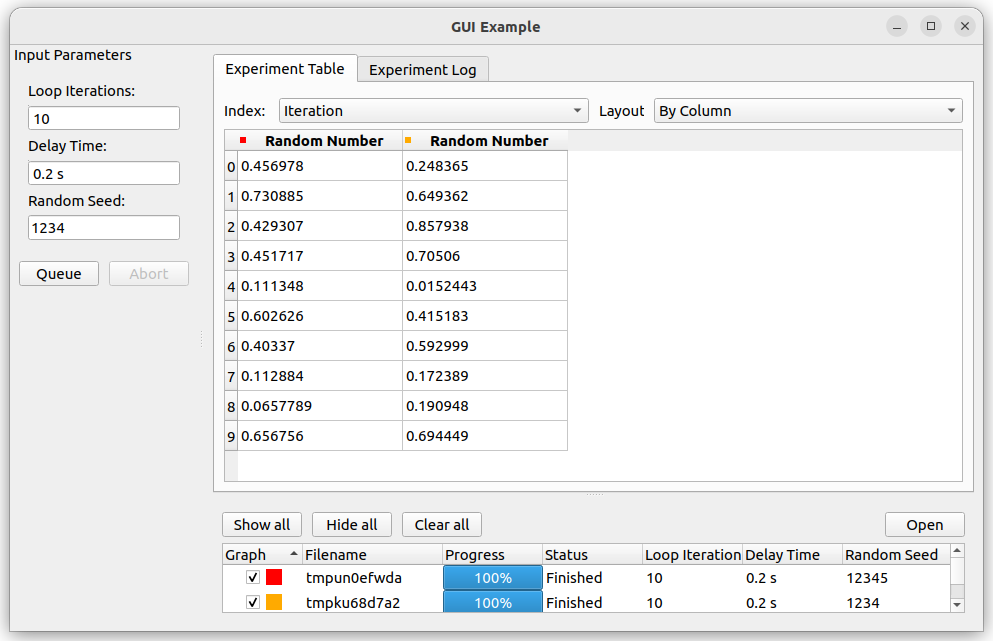
Using tabular format
In some experiments, data in tabular format may be useful in addition or in alternative to graphical plot.
ManagedWindowBase allows adding a TableWidget to show
experiments data, the widget supports also exporting data in some popular format like CSV, HTML, etc.
Below an example on how to customize ManagedWindowBase to use tabular format,
it derived from example above and changed lines are marked.
 import logging
 log = logging.getLogger(__name__)
 log.addHandler(logging.NullHandler())

 import sys
 import tempfile
 import random
 from time import sleep
 from pymeasure.log import console_log
 from pymeasure.display.Qt import QtWidgets
 from pymeasure.display.windows import ManagedWindowBase
 from pymeasure.display.widgets import TableWidget, LogWidget
 from pymeasure.experiment import Procedure, Results
 from pymeasure.experiment import IntegerParameter, FloatParameter, Parameter

 class RandomProcedure(Procedure):

     iterations = IntegerParameter('Loop Iterations', default=10)
     delay = FloatParameter('Delay Time', units='s', default=0.2)
     seed = Parameter('Random Seed', default='12345')

     DATA_COLUMNS = ['Iteration', 'Random Number']

     def startup(self):
         log.info("Setting the seed of the random number generator")
         random.seed(self.seed)

     def execute(self):
         log.info("Starting the loop of %d iterations" % self.iterations)
         for i in range(self.iterations):
             data = {
                 'Iteration': i,
                 'Random Number': random.random()
             }
             self.emit('results', data)
             log.debug("Emitting results: %s" % data)
             self.emit('progress', 100 * i / self.iterations)
             sleep(self.delay)
             if self.should_stop():
                 log.warning("Caught the stop flag in the procedure")
                 break


 class MainWindow(ManagedWindowBase):

     def __init__(self):
         widget_list = (TableWidget("Experiment Table",
                                    RandomProcedure.DATA_COLUMNS,
                                    by_column=True,
                                    ),
                        LogWidget("Experiment Log"),
                        )
         super().__init__(
             procedure_class=RandomProcedure,
             inputs=['iterations', 'delay', 'seed'],
             displays=['iterations', 'delay', 'seed'],
             widget_list=widget_list,
         )
         logging.getLogger().addHandler(widget_list[1].handler)
         log.setLevel(self.log_level)
         log.info("ManagedWindow connected to logging")
         self.setWindowTitle('GUI Example')

 if __name__ == "__main__":
     app = QtWidgets.QApplication(sys.argv)
     window = MainWindow()
     window.show()
     sys.exit(app.exec())
This results in the following graphical display.
Defining your own ManagedWindow’s widgets
The parameter widget_list in ManagedWindowBase constructor allow to introduce user’s defined widget in the GUI results display area.
The user’s widget should inherit from TabWidget and could reimplement any of the methods that needs customization.
In order to get familiar with the mechanism, users can check the following widgets already provided:
Using the interactive Python console
Sometimes it is useful to interact with the application live while it is running, to query the state of the instrument or control the instrument. PyMeasure provides a ConsoleWidget which can be embedded directly into the ManagedWindow.
You can expose variables, instruments, and modules to this console by passing a namespace dictionary during initialization. Because ManagedWindow places its default widgets (like the plot and log) at the end of the widget_list parameter, it is common to manually append the ConsoleWidget after super().__init__() if you want it to appear as the right-most tab.
 from pymeasure.display.widgets.console_widget import ConsoleWidget

 class MainWindow(ManagedWindow):

     def __init__(self):
         super().__init__(
             procedure_class=RandomProcedure,
             inputs=['iterations', 'delay', 'seed'],
             displays=['iterations', 'delay', 'seed'],
             x_axis='Iteration',
             y_axis='Random Number',
         )
         self.setWindowTitle('GUI Example')

         # 1. Create the console widget and expose variables to it
         self.console_widget = ConsoleWidget(
             "Script Console",
             namespace={
                 'window': self,
                 'device': '<your_instrument>', # replace with your instrument instance
                 'np': '<numpy_module>' # replace with numpy if imported
             }
         )

         # 2. Append it manually so it appears as the last tab
         self.widget_list += (self.console_widget,)
         self.tabs.addTab(self.console_widget, self.console_widget.name)
Using the sequencer
As an extension to the way of graphically inputting parameters and executing multiple measurements using the ManagedWindow, SequencerWidget is provided which allows users to queue a series of measurements with varying one, or more, of the parameters. This sequencer thereby provides a convenient way to scan through the parameter space of the measurement procedure.
To activate the sequencer, two additional keyword arguments are added to ManagedWindow, namely sequencer and sequencer_inputs. sequencer accepts a boolean stating whether or not the sequencer has to be included into the window and sequencer_inputs accepts either None or a list of the parameter names are to be scanned over. If no list of parameters is given, the parameters displayed in the manager queue are used.
In order to be able to use the sequencer, the ManagedWindow class is required to have a queue method which takes a keyword (or better keyword-only for safety reasons) argument procedure, where a procedure instance can be passed. The sequencer will use this method to queue the parameter scan.
In order to implement the sequencer into the previous example, only the ManagedWindow has to be modified slightly (where modified lines are marked):
 class MainWindow(ManagedWindow):

     def __init__(self):
         super().__init__(
             procedure_class=TestProcedure,
             inputs=['iterations', 'delay', 'seed'],
             displays=['iterations', 'delay', 'seed'],
             x_axis='Iteration',
             y_axis='Random Number',
             sequencer=True,                                      # Added line
             sequencer_inputs=['iterations', 'delay', 'seed'],    # Added line
             sequence_file="gui_sequencer_example_sequence.txt",  # Added line, optional
         )
         self.setWindowTitle('GUI Example')
This adds the sequencer underneath the input panel.
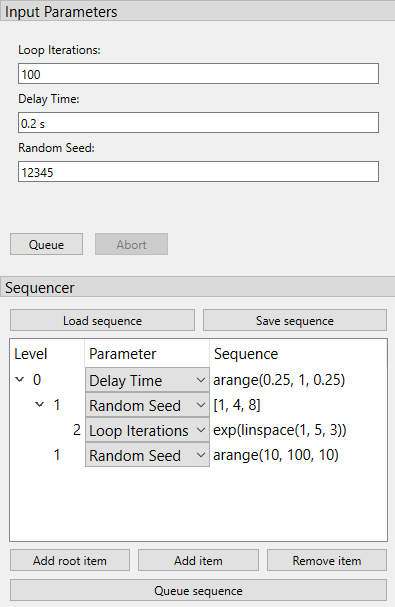
The widget contains a tree-view where you can build the sequence.
It has three columns: level (indicated how deep an item is nested), parameter (a drop-down menu to select which parameter is being sequenced by that item), and sequence (the text-box where you can define the sequence).
While the two former columns are rather straightforward, filling in the later requires some explanation.
In order to maintain flexibility, the sequence is defined in a text-box, allowing the user to enter any list-generating single-line piece of code.
To assist in this, a number of functions is supported, either from the main python library (namely range, sorted, and list) or the numpy library.
The supported numpy functions (prepending numpy. or any abbreviation is not required) are: arange, linspace, arccos, arcsin, arctan, arctan2, ceil, cos, cosh, degrees, e, exp, fabs, floor, fmod, frexp, hypot, ldexp, log, log10, modf, pi, power, radians, sin, sinh, sqrt, tan, and tanh.
As an example, arange(0, 10, 1) generates a list increasing with steps of 1, while using exp(arange(0, 10, 1)) generates an exponentially increasing list.
This way complex sequences can be entered easily.
The sequences can be extended and shortened using the buttons Add root item, Add item, and Remove item.
The latter two either add an item as a child of the currently selected item or remove the selected item, respectively.
To queue the entered sequence the button Queue sequence can be used.
If an error occurs in evaluating the sequence text-boxes, this is mentioned in the logger, and nothing is queued.
Finally, it is possible to create a sequence file such that the user does not need to write the sequence again each time. The sequence file can be created by saving current sequence built within the GUI using the Save sequence button or directly writing a simple text file.
Once created, the sequence can be loaded with the Load sequence button.
In the sequence file each line adds one item to the sequence tree, starting with a number of dashes (-) to indicate the level of the item (starting with 1 dash for top level), followed by the name of the parameter and the sequence string, both as a python string between parentheses.
An example of such a sequence file is given below, resulting in the sequence shown in the figure above.
- "Delay Time", "arange(0.25, 1, 0.25)"
-- "Random Seed", "[1, 4, 8]"
--- "Loop Iterations", "exp(linspace(1, 5, 3))"
-- "Random Seed", "arange(10, 100, 10)"
This file can also be automatically loaded at the start of the program by adding the key-word argument sequence_file="filename.txt" to the super().__init__ call, as was done in the example.
Using the estimator widget
In order to provide estimates of the measurement procedure, an EstimatorWidget is provided that allows the user to define and calculate estimates.
The widget is automatically activated when the get_estimates method is added in the Procedure.
The quickest and most simple implementation of the get_estimates function simply returns the estimated duration of the measurement in seconds (as an int or a float).
As an example, in the example provided in the Using the ManagedWindow section, the Procedure is changed to:
class RandomProcedure(Procedure):

    # ...

    def get_estimates(self, sequence_length=None, sequence=None):

        return self.iterations * self.delay
This will add the estimator widget at the dock on the left. The duration and finishing-time of a single measurement is always displayed in this case. Depending on whether the SequencerWidget is also used, the length, duration and finishing-time of the full sequence is also shown.
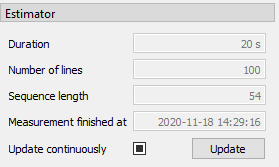
For maximum flexibility (e.g. for showing multiple and other types of estimates, such as the duration, filesize, finishing-time, etc.) it is also possible that the get_estimates returns a list of tuples.
Each of these tuple consists of two strings: the first is the name (label) of the estimate, the second is the estimate itself.
As an example, in the example provided in the Using the ManagedWindow section, the Procedure is changed to:
class RandomProcedure(Procedure):

    # ...

    def get_estimates(self, sequence_length=None, sequence=None):

        duration = self.iterations * self.delay

        estimates = [
            ("Duration", "%d s" % int(duration)),
            ("Number of lines", "%d" % int(self.iterations)),
            ("Sequence length", str(sequence_length)),
            ('Measurement finished at', str(datetime.now() + timedelta(seconds=duration))),
        ]

        return estimates
This will add the estimator widget at the dock on the left.
Note that after the initialisation of the widget both the label of the estimate as of course the estimate itself can be modified, but the amount of estimates is fixed.
The keyword arguments are not required in the implementation of the function, but are passed if asked for (i.e. def get_estimates(self) does also works).
Keyword arguments that are accepted are sequence, which contains the full sequence of the sequencer (if present), and sequence_length, which gives the length of the sequence as integer (if present).
If the sequencer is not present or the sequence cannot be parsed, both sequence and sequence_length will contain None.
The estimates are automatically updated every 2 seconds. Changing this update interval is possible using the “Update continuously”-checkbox, which can be toggled between three states: off (i.e. no updating), auto-update every two seconds (default) or auto-update every 100 milliseconds. Manually updating the estimates (useful whenever continuous updating is turned off) is also possible using the “update”-button.
Flexible hiding of inputs
There can be situations when it may be relevant to turn on or off a number of inputs (e.g. when a part of the measurement script is skipped upon turning of a single BooleanParameter).
For these cases, it is possible to assign a Parameter to a controlling Parameter, which will hide or show the Input of the Parameter depending on the value of the Parameter.
This is done with the group_by key-word argument.
toggle = BooleanParameter("toggle", default=True)
param = FloatParameter('some parameter', group_by='toggle')
When both the toggle and param are visible in the InputsWidget (via inputs=['iterations', 'delay', 'seed'] as demonstrated above) one can control whether the input-field of param is visible by checking and unchecking the checkbox of toggle.
By default, the group will be visible if the value of the group_by Parameter is True (which is only relevant for a BooleanParameter), but it is possible to specify other value as conditions using the group_condition keyword argument.
iterations = IntegerParameter('Loop Iterations', default=100)
param = FloatParameter('some parameter', group_by='iterations', group_condition=99)
Here the input of param is only visible if iterations has a value of 99.
This works with any type of Parameter as group_by parameter.
To allow for even more flexibility, it is also possible to pass a (lambda)function as a condition:
iterations = IntegerParameter('Loop Iterations', default=100)
param = FloatParameter('some parameter', group_by='iterations', group_condition=lambda v: 50 < v < 100)
Now the input of param is only shown if the value of iterations is between 51 and 99.
Using the hide_groups keyword-argument of the ManagedWindow you can choose between hiding the groups (hide_groups = True) and disabling / graying-out the groups (hide_groups = False).
Finally, it is also possible to provide multiple parameters to the group_by argument, in which case the input will only be visible if all of the conditions are true.
Multiple parameters for grouping can either be passed as a dict of string: condition pairs, or as a list of strings, in which case the group_condition can be either a single condition or a list of conditions:
iterations = IntegerParameter('Loop Iterations', default=100)
toggle = BooleanParameter('A checkbox')
param_A = FloatParameter('some parameter', group_by=['iterations', 'toggle'], group_condition=[lambda v: 50 < v < 100, True])
param_B = FloatParameter('some parameter', group_by={'iterations': lambda v: 50 < v < 100, 'toggle': True})
Note that in this example, param_A and param_B are identically grouped: they’re only visible if iterations is between 51 and 99 and if the toggle checkbox is checked (i.e. True).
Using the ManagedDockWindow
Building off the Using the ManagedWindow section where we used a ManagedWindow, we can also use ManagedDockWindow to build a graphical interface with multiple graphs that can be docked in the main GUI window or popped out into their own window.
To start with, let’s make the following highlighted edits to the code example from Using the ManagedWindow:
On line 10 we now import
ManagedDockWindowOn line 20, and lines 32 and 33, we add two new columns of data to be recorded
'Random Number 2'and'Random Number 3'On line 44 we make
MainWindowa subclass ofManagedDockWindowOn line 51 we will pass in a list of strings from
DATA_COLUMNSto thex_axisargumentOn line 52 we will pass in a list of strings from
DATA_COLUMNSto they_axisargument
import logging
log = logging.getLogger(__name__)
log.addHandler(logging.NullHandler())

import sys
import tempfile
import random
from time import sleep
from pymeasure.display.Qt import QtWidgets
from pymeasure.display.windows.managed_dock_window import ManagedDockWindow
from pymeasure.experiment import Procedure, Results
from pymeasure.experiment import IntegerParameter, FloatParameter, Parameter

class RandomProcedure(Procedure):

    iterations = IntegerParameter('Loop Iterations', default=10)
    delay = FloatParameter('Delay Time', units='s', default=0.2)
    seed = Parameter('Random Seed', default='12345')

    DATA_COLUMNS = ['Iteration', 'Random Number 1', 'Random Number 2', 'Random Number 3']

    def startup(self):
        log.info("Setting the seed of the random number generator")
        random.seed(self.seed)

    def execute(self):
        log.info("Starting the loop of %d iterations" % self.iterations)
        for i in range(self.iterations):
            data = {
                'Iteration': i,
                'Random Number 1': random.random(),
                'Random Number 2': random.random(),
                'Random Number 3': random.random()
            }
            self.emit('results', data)
            log.debug("Emitting results: %s" % data)
            self.emit('progress', 100 * i / self.iterations)
            sleep(self.delay)
            if self.should_stop():
                log.warning("Caught the stop flag in the procedure")
                break


class MainWindow(ManagedDockWindow):

    def __init__(self):
        super().__init__(
            procedure_class=RandomProcedure,
            inputs=['iterations', 'delay', 'seed'],
            displays=['iterations', 'delay', 'seed'],
            x_axis=['Iteration', 'Random Number 1'],
            y_axis=['Random Number 1','Random Number 2', 'Random Number 3']
        )
        self.setWindowTitle('GUI Example')


if __name__ == "__main__":
    app = QtWidgets.QApplication(sys.argv)
    window = MainWindow()
    window.show()
    sys.exit(app.exec())
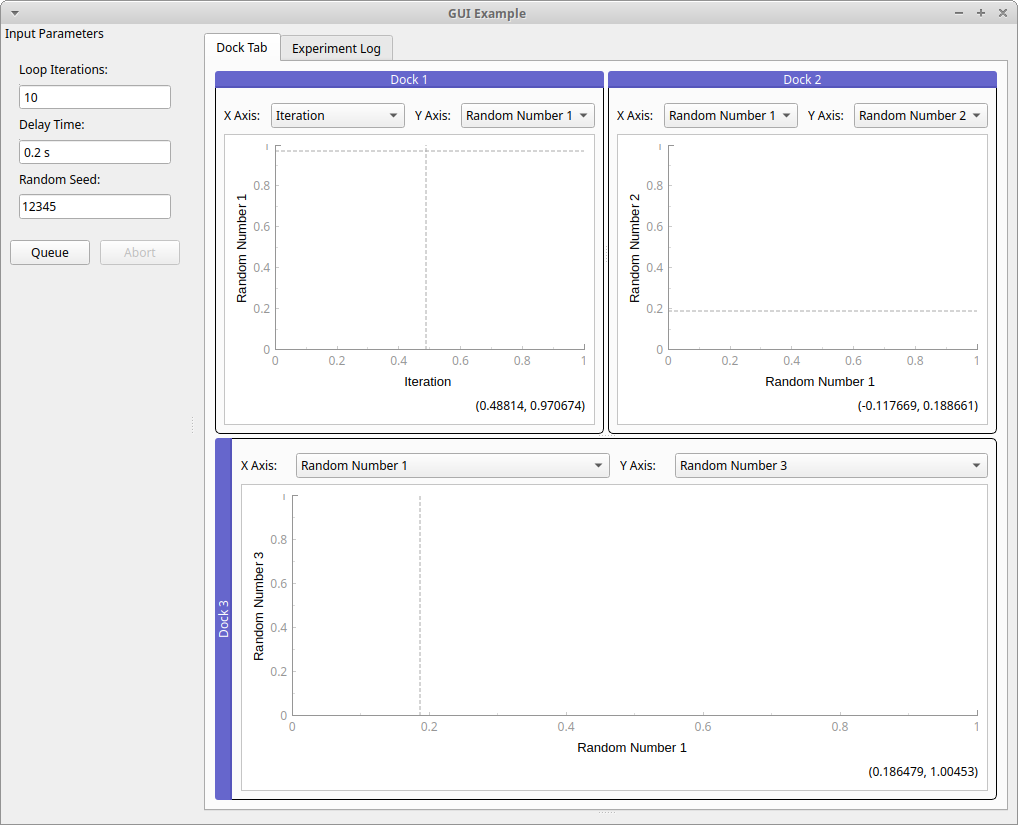
Now we can see our ManagedDockWindow:
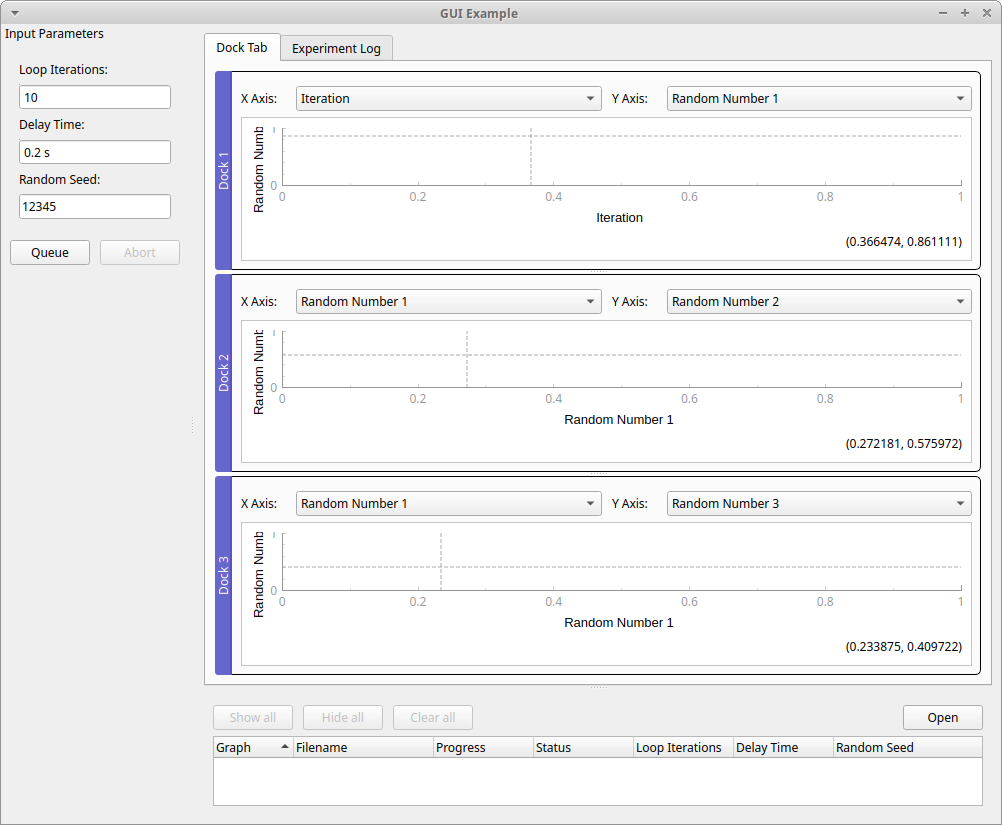
As you can see from the above screenshot, our example code created three docks with following “X Axis” and “Y Axis” labels:
X Axis: “Iteration” Y Axis: “Random Number 1”
X Axis: “Random Number 1” Y Axis: “Random Number 2”
X Axis: “Random Number 1” Y Axis: “Random Number 3”
The list of strings for x_axis and y_axis set the default labels for each dockable plot and the longest list determines how many dockable plots are created. To highlight this point, in our example we define x_axis and y_axis with the following lists:
x_axis=['Iteration', 'Random Number 1'],
y_axis=['Random Number 1','Random Number 2', 'Random Number 3']
If one list is longer, the last element of the other list is used as the default label for the rest of the dockable plots.
In our example that is why we have two X Axis labels with “Random Number 1”.
The longest list between x_axis and y_axis determines the number of plots.
In our example y_axis has the longest list with a length of three so three plots are created.
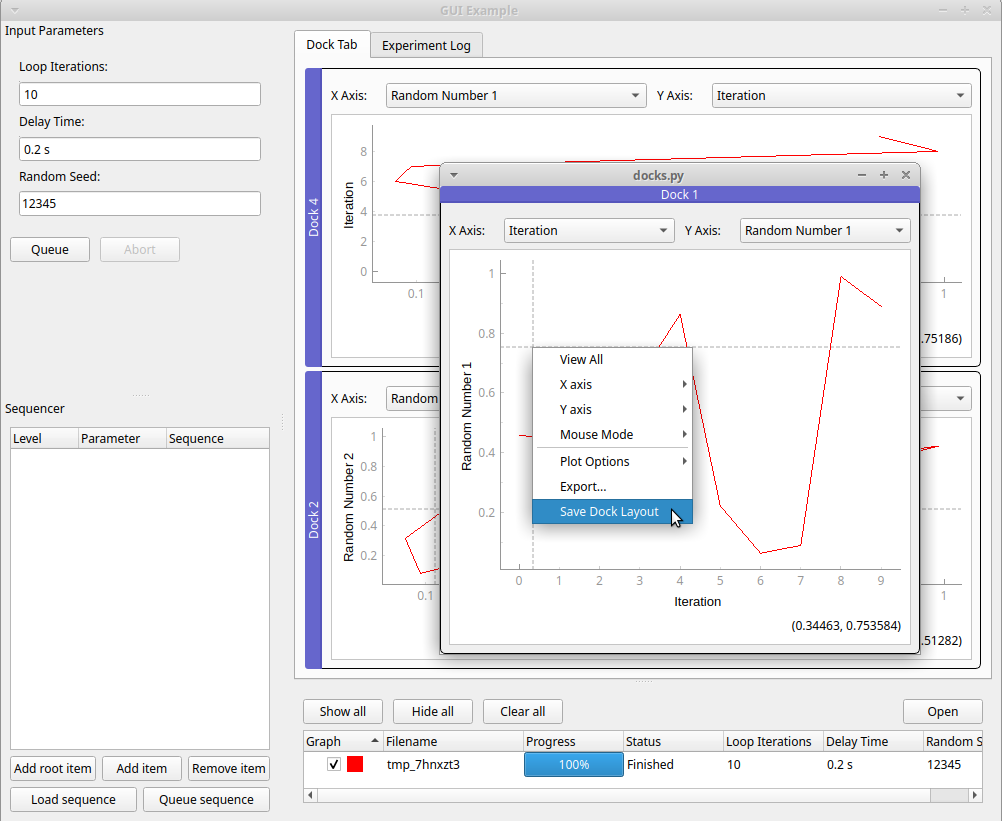
You can pop out a dockable plot from the main dock window to its own window by double clicking the blue “Dock #” title bar, which is to the left of each plot by default:
You can return the popped out window to the main window by clicking the close icon X in the top right.
After positioning your dock windows, you can save the layout by right-clicking a dock widget and select “Save Dock Layout” from the context menu.
This will save the layout of all docks and the settings for each plot to a file. By default the file path is the current working directory of the python file
that started ManagedDockWindow, and the default file name is ‘procedure class + “_dock_layout.json”’. For our example, that would be “./RandomProcedure_dock_layout.json”
When you run the python file that invokes ManagedDockWindow again, it will look for and load the dock layout file if it exists.
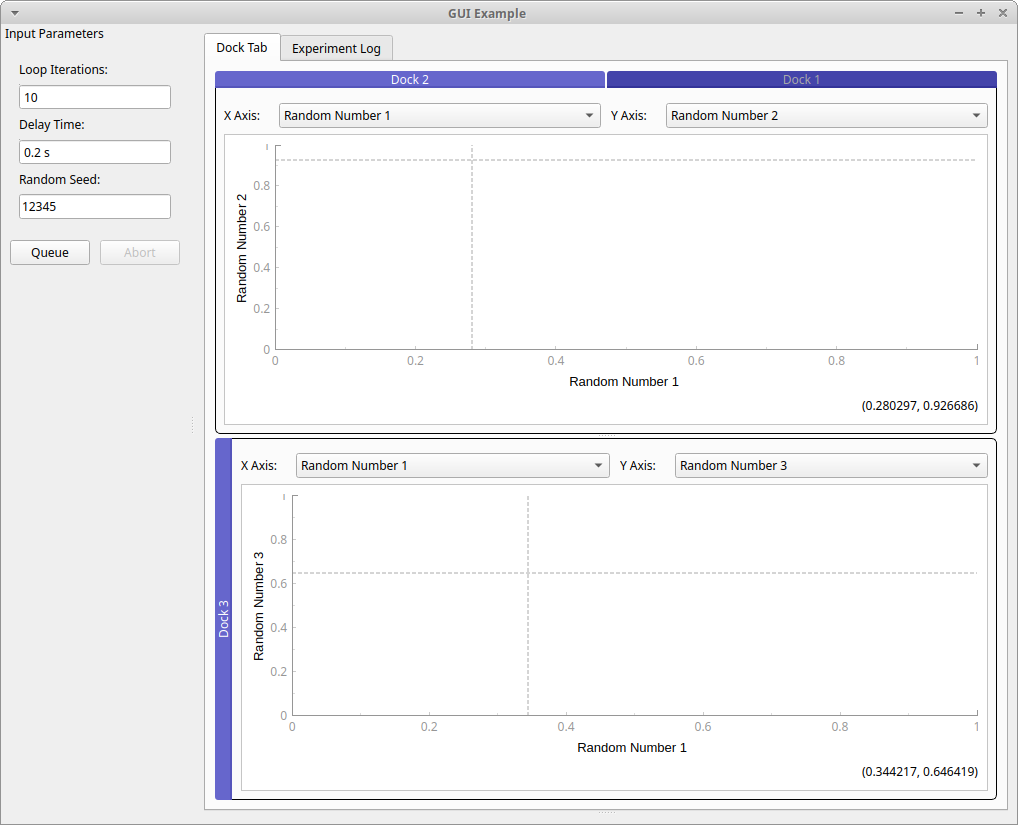
You can drag a dockable plot to reposition it in reference to other plots in the main dock window in several ways. You can drag the blue “Dock #” title bar to the left or right side of another plot to reposition a plot to be side by side with another plot:
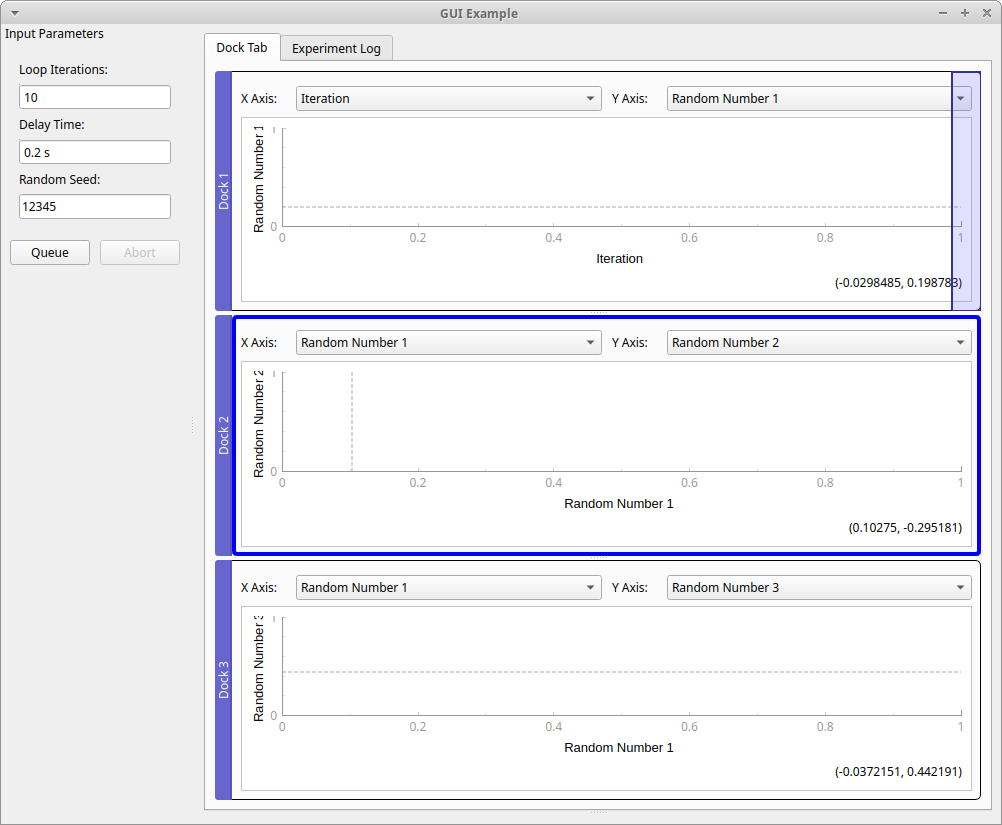
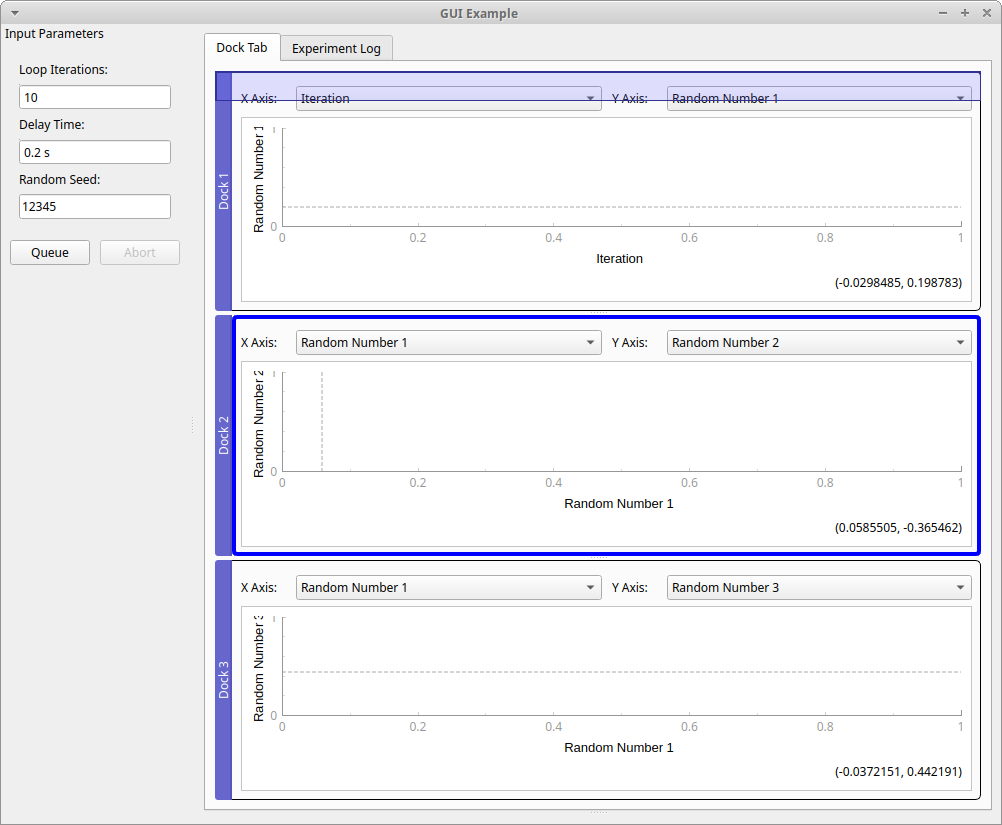
You can also drag the blue “Dock #” title bar to the top or bottom side of another plot to reposition a plot to rearrange the vertical order of the plots:
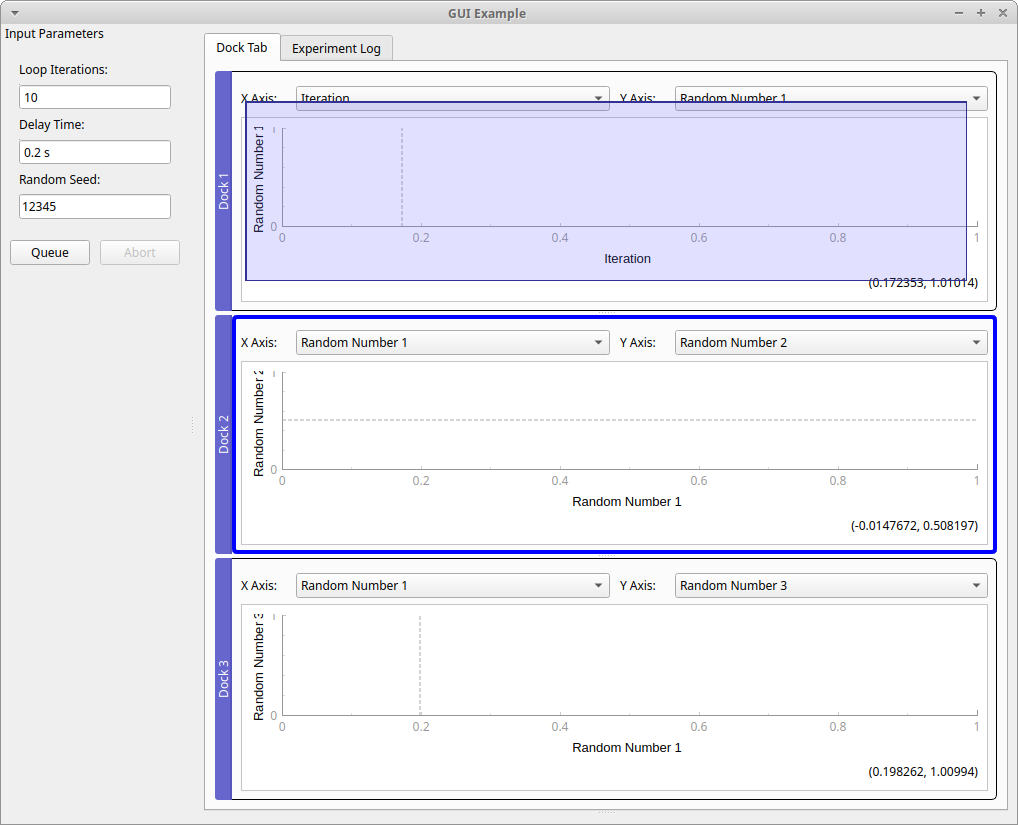
You can drag the blue “Dock #” title bar to the middle of another plot to reposition a plot to create a tabbed view of the two plots:
Using the ManagedConsole
The ManagedConsole is the most convenient tool for running measurements with your Procedure using a command line interface. The ManagedConsole allows to run an experiment with the same set of parameters available in the ManagedWindow, but they are defined using a set of command line switches.
It is also possible to define a test that uses both ManagedConsole or ManagedWindow according to user selection in the command line.
Enabling console mode is easy and straightforward and the following example demonstrates how to do it.
The following example is a variant of the code example from Using the ManagedWindow where some parts have been highlighted:
On line 8 we now import
ManagedConsoleOn line 73, we add the support for console mode
import sys
import random
import tempfile
from time import sleep

from pymeasure.experiment import Procedure, IntegerParameter, Parameter, FloatParameter
from pymeasure.experiment import Results
from pymeasure.display.console import ManagedConsole
from pymeasure.display.Qt import QtWidgets
from pymeasure.display.windows import ManagedWindow
import logging

log = logging.getLogger('')
log.addHandler(logging.NullHandler())


class TestProcedure(Procedure):
    iterations = IntegerParameter('Loop Iterations', default=100)
    delay = FloatParameter('Delay Time', units='s', default=0.2)
    seed = Parameter('Random Seed', default='12345')

    DATA_COLUMNS = ['Iteration', 'Random Number']

    def startup(self):
        log.info("Setting up random number generator")
        random.seed(self.seed)

    def execute(self):
        log.info("Starting to generate numbers")
        for i in range(self.iterations):
            data = {
                'Iteration': i,
                'Random Number': random.random()
            }
            log.debug("Produced numbers: %s" % data)
            self.emit('results', data)
            self.emit('progress', 100 * (i + 1) / self.iterations)
            sleep(self.delay)
            if self.should_stop():
                log.warning("Catch stop command in procedure")
                break

    def shutdown(self):
        log.info("Finished")


class MainWindow(ManagedWindow):

    def __init__(self):
        super(MainWindow, self).__init__(
            procedure_class=TestProcedure,
            inputs=['iterations', 'delay', 'seed'],
            displays=['iterations', 'delay', 'seed'],
            x_axis='Iteration',
            y_axis='Random Number'
        )
        self.setWindowTitle('GUI Example')


if __name__ == "__main__":
    if len(sys.argv) > 1:
        # If any parameter is passed, the console mode is run
        # This criteria can be changed at user discretion
        app = ManagedConsole(procedure_class=TestProcedure)
    else:
        app = QtWidgets.QApplication(sys.argv)
        window = MainWindow()
        window.show()

    sys.exit(app.exec())
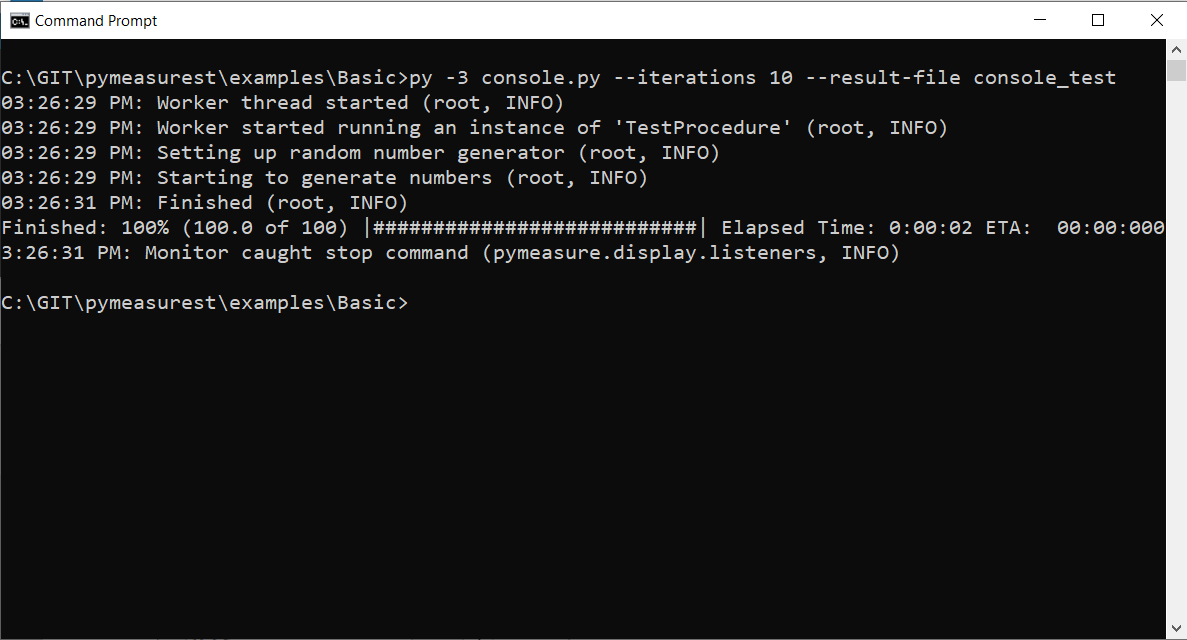
If we run the script above without any parameter, you will have the graphical user interface example. If you run as follow, you will use the command line mode:
python console.py --iterations 10 --result-file console_test
Console output is as follow (to show the progress bar, you need to install the optional module progressbar2):
Other useful commands
To show all the command line switches:
python console.py --help
To run an experiment with parameters retrieved from an existing result file.
python console.py --use-result-file console_test2023-08-09_1.csv